As an Amazon affiliate, I may earn from qualifying purchases. Please read our Disclaimer and Privacy Policy.
Knowing the key Facts About Aging Populations can help us come up with better policies and strategies to make sure older adults are supported and thriving.
The U.S. Department of Health has been pointing out how important it is to tackle the challenges that come with this shift for senior citizens.
By examining key health statistics, like the ones found in this post, we can gain a better understanding of these trends and their implications for today’s older adults.
Taking a closer look at key health statistics helps us get a better picture of what these changes mean for older adults today.
The facts about aging populations in this post highlight the need for innovative policies and resources to help senior citizens thrive as vital members of society.
Frequently Asked Questions About Aging Populations
I’ve designed this post with a series of frequently asked questions related to aging populations. Each heading is a question, followed by a statistic and brief explanation.
You’ll find the sources of these statistics at the bottom of the post, along with a free infographic that you can use for your own purposes. Just copy the embed code!
1. How many people turn 60 every year?
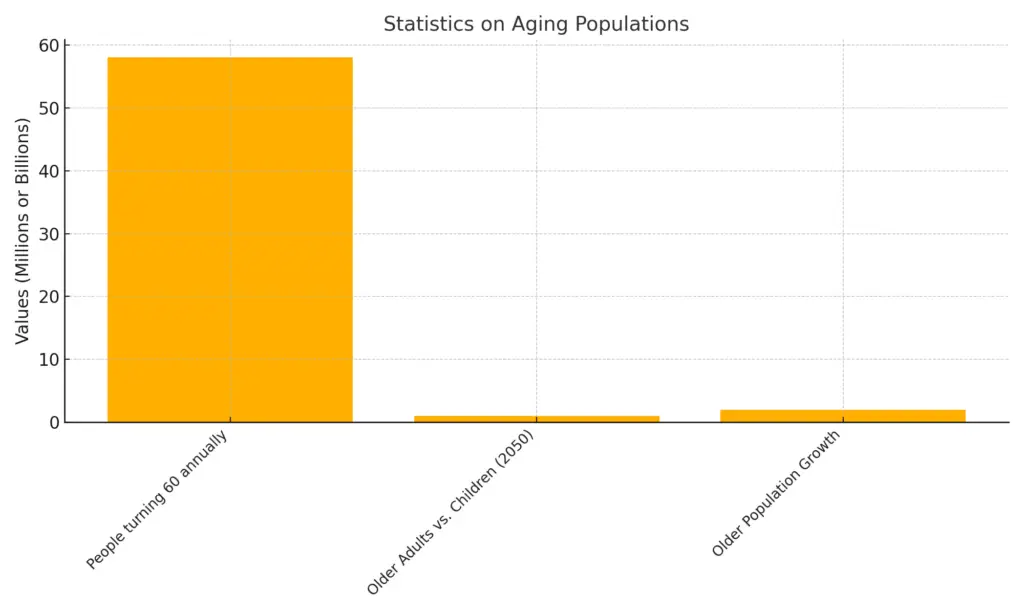
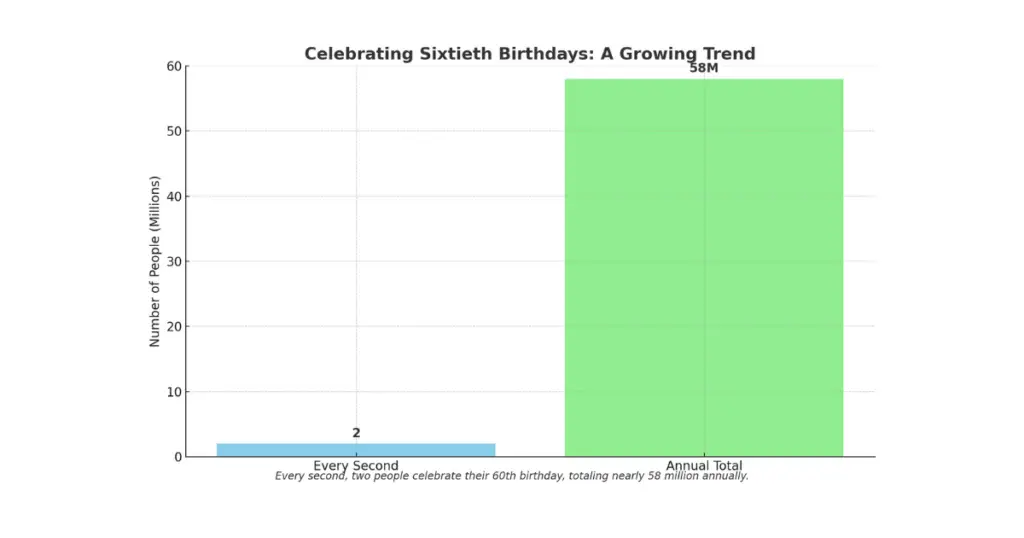
Every second, two people celebrate their 60th birthday, totaling nearly 58 million sixtieth birthdays annually.
This marks a profound demographic change as the proportion of people in older age groups grows rapidly.
2. Will there be more older people than children in the future?
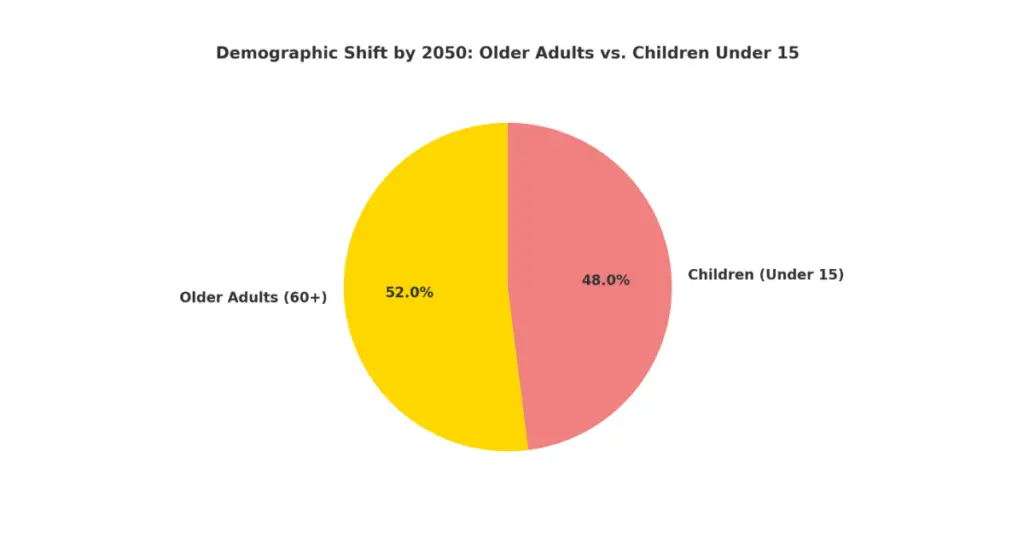
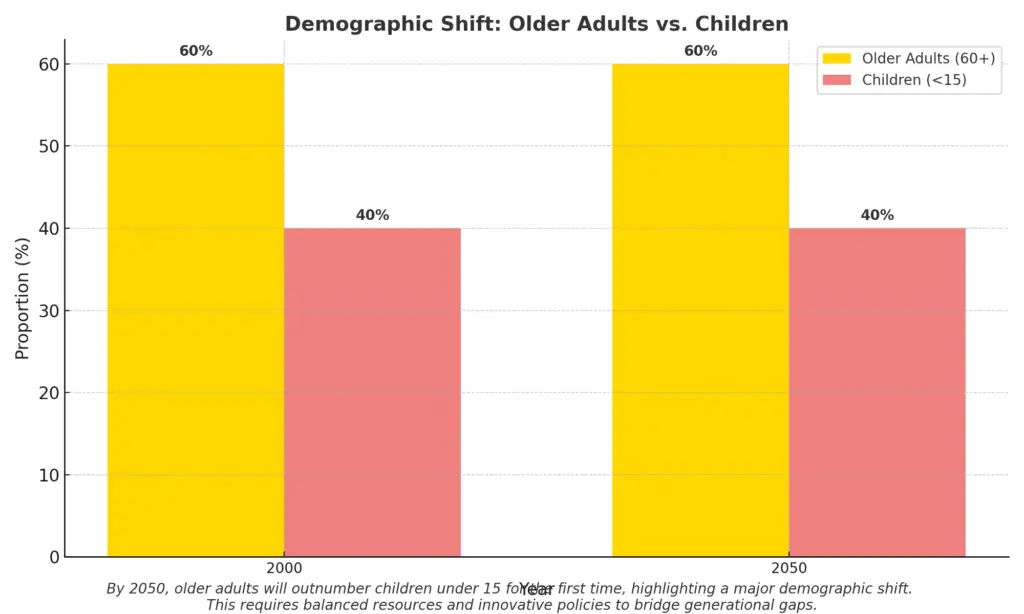
By 2050, for the first time in history, there will be more older people than children under 15.
In fact, by 2000, there were already more people aged 60 or over than children under 5.
This demographic shift will challenge disease control systems and increase the need for policies that bridge the gap between older and young people.
These facts about aging populations demonstrate the need to balance resources for all age groups effectively.
3. How fast is the global population of older adults growing?
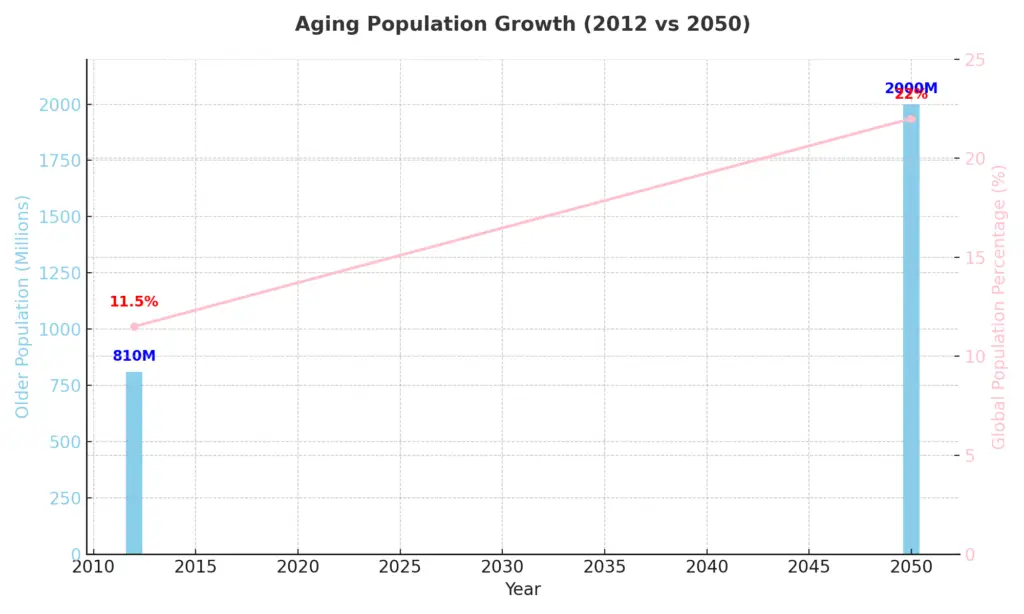
In 2012, 810 million people were aged 60 or over, accounting for 11.5% of the global population.
By 2050, that number is expected to reach 2 billion, or 22% of the world’s population.
In the United States, the profile of older Americans reflects similar growth trends, with baby boomers driving much of the increase.
This rapid increase further highlights facts about aging populations and their implications for health care systems and policy planning.
4. How does life expectancy differ between regions?
Between 2010 and 2015, life expectancy was 78 years in developed countries compared to 68 years in developing regions.
By 2045-2050, these figures are projected to rise to 83 years and 74 years, respectively.
- The 83 years refers to the projected life expectancy in developed countries by 2045-2050.
- The 74 years refers to the projected life expectancy in developing regions by the same time period.
Despite these gains, elderly women in rural areas often face unique health problems due to limited access to health care providers and resources.
These facts about aging populations emphasize the importance of equitable access to quality health care for older adults.
5. Where do most older adults live?
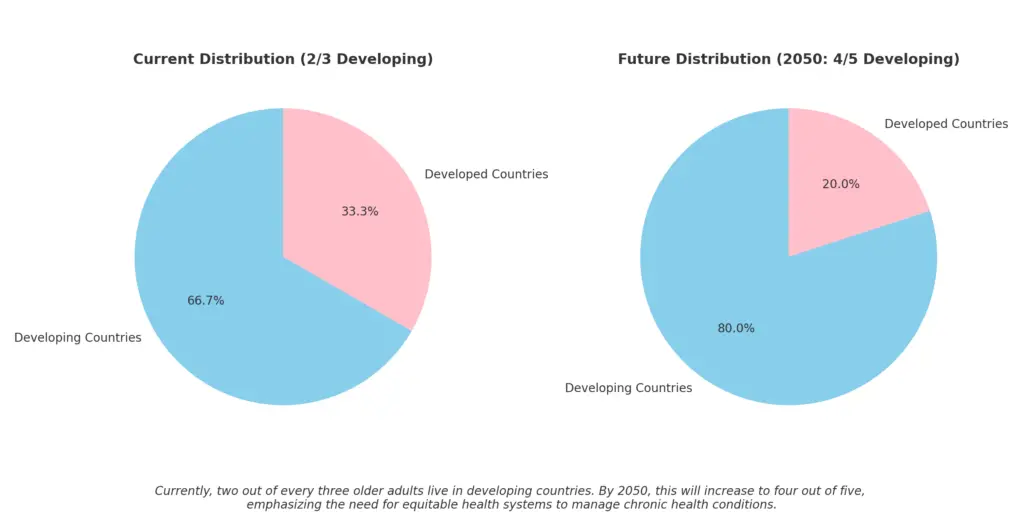
Currently, two out of every three people aged 60 or over live in developing countries.
By 2050, this will increase to nearly four out of five older adults.
The concentration of older populations in these regions highlights the urgent need for equitable health systems to manage chronic health conditions effectively.
Understanding facts about aging populations helps guide efforts to address these challenges.
6. What is the future of centenarians?
The number of centenarians (people aged 100 or over) is expected to grow from 316,600 in 2011 to 3.2 million by 2050.
As more people live to very old age, addressing chronic conditions and supporting their quality of life will be paramount.
These facts about aging populations remind us of the importance of planning for long-term care needs.
7. How prevalent are chronic conditions among older adults?
Non-communicable diseases (NCDs) accounted for 73.9% of global deaths in 2019, with older populations bearing the largest burden.
Chronic health conditions such as heart disease, hypertension, and Alzheimer’s disease continue to pose significant challenges for health care providers.
8. What percentage of older adults remain in the workforce?
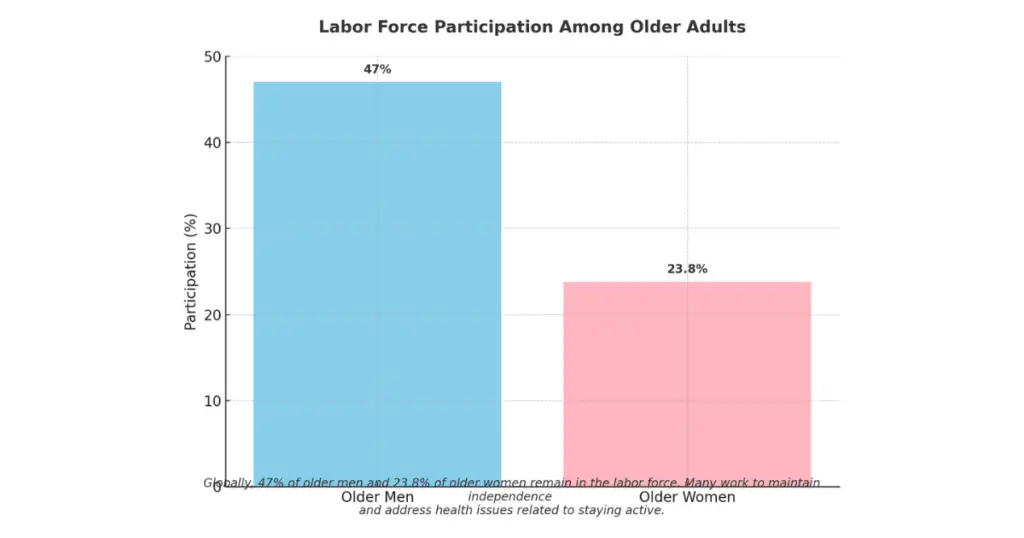
Globally, 47% of older men and 23.8% of older women continue to participate in the labor force.
Many older adults choose to work to maintain independence and address health issues related to staying active.
9. What about social protections?
Only 28% of the global population lives in countries with comprehensive social protection schemes.
In the U.S., programs like Social Security are crucial in ensuring financial security for older adults, particularly in rural areas where economic opportunities may be limited.
10. How has COVID-19 impacted older populations?
The pandemic disproportionately affected older individuals, with the majority of the 8.8 million global deaths in 2021 occurring among those over 50.
Telehealth and other innovations have played a key role in addressing health problems for this vulnerable age group.
11. How do older adults view their quality of life?
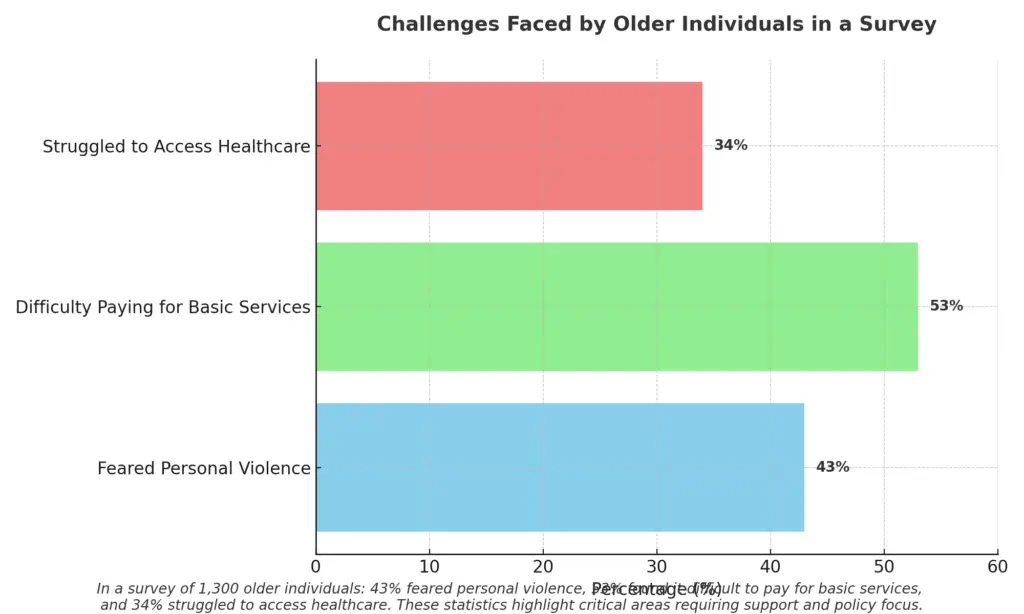
In a survey of 1,300 older individuals:
- 43% feared personal violence.
- 53% found it difficult to pay for basic services.
- 34% struggled to access healthcare.
These statistics underscore the importance of improving social environments to support both elderly men and women.
12. How is the older population distributed geographically in the United States?
In 2022, half of all Americans aged 65 and older lived in just nine states, including California, Florida, and Texas.
Rural areas in states like Maine and Florida have the highest proportions of older residents, creating unique challenges for disease control and resource allocation.
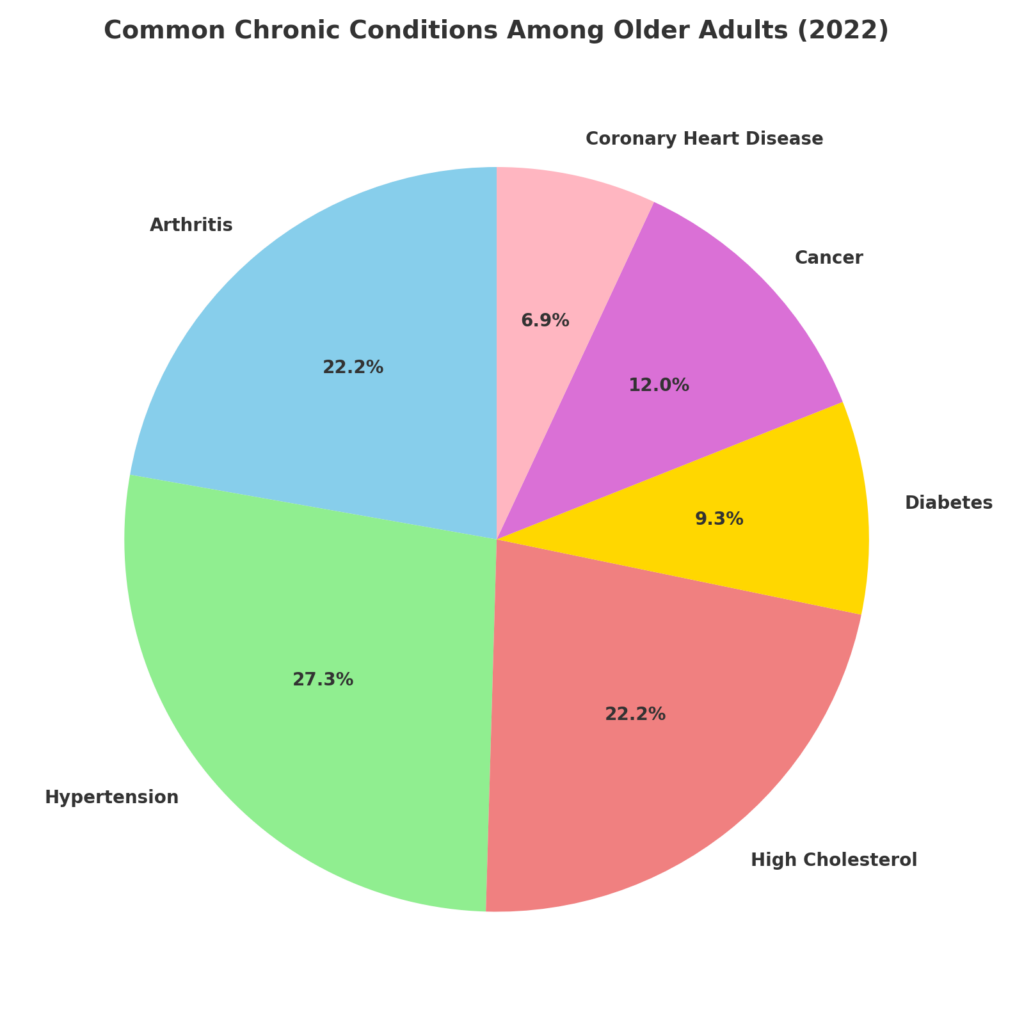
13. What are the most common chronic conditions among older adults?
In 2022, common chronic conditions among older adults included:
- Arthritis: 48%
- Hypertension: 59%
- High cholesterol: 48%
- Diabetes: 20%
- Cancer: 26%
- Coronary heart disease: 15%
14. What are the living arrangements of older adults?
In 2023, 59% of older adults lived with their spouse or partner, while 28% lived alone. The percentage of older women living alone increases with age; for example, 42% of women aged 75 and older lived alone.
Effective management of these health issues is essential for promoting good health and improving the quality of life for aging populations.
15. How do living arrangements vary among older adults?
In 2023, 59% of older adults lived with a spouse or partner, while 28% lived alone. Elderly women are more likely to live alone than elderly men, with 42% of women aged 75 and older living solo.
16. How common is disability among older Americans?
In 2022, 33% of adults aged 65 and older reported having a disability. Disabilities included serious difficulty walking or climbing stairs (21%), hearing (14%), and seeing (6%). These limitations can significantly affect independent living.
17. How many older adults are in the workforce?
In 2023, 11.2 million Americans aged 65 and older were working or actively seeking work. This group constituted 19.2% of the older population and 6.7% of the total U.S. labor force.
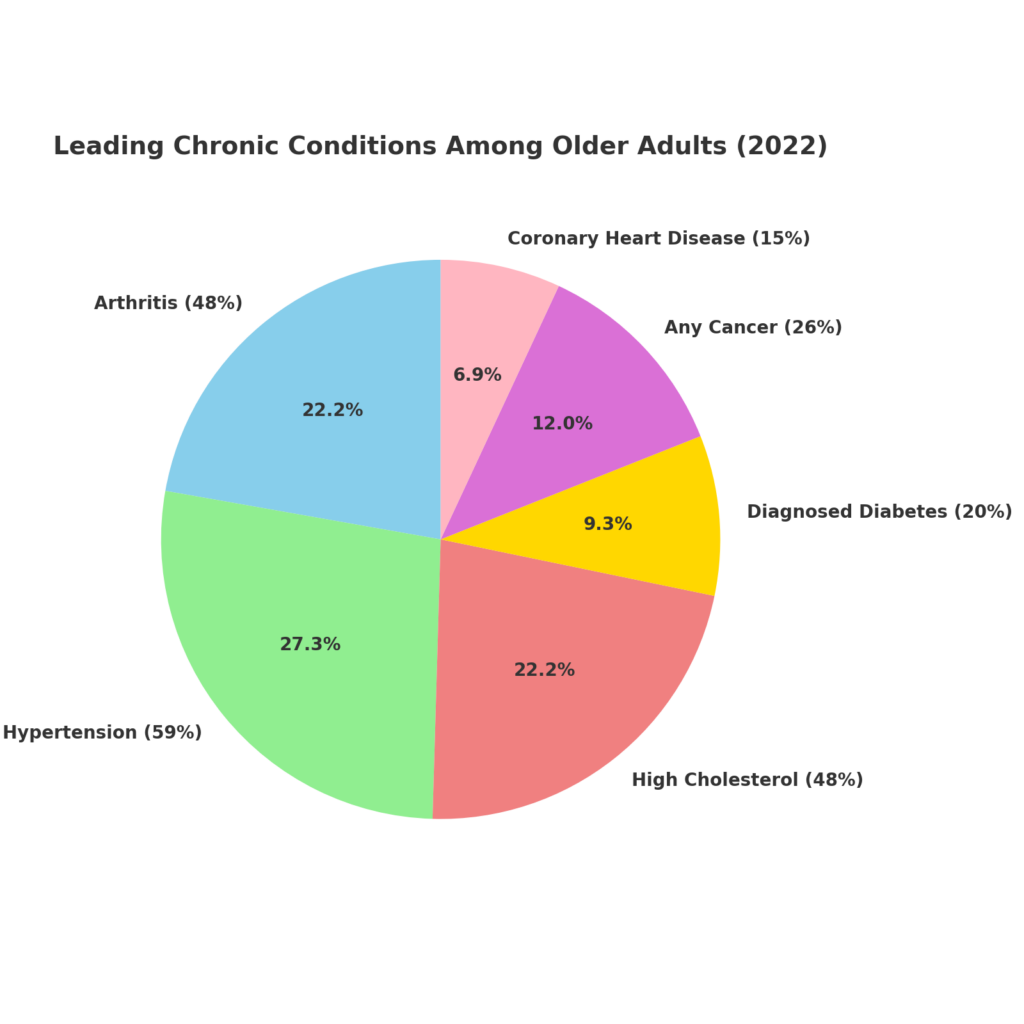
18. What are the most common chronic conditions among older adults?
Leading chronic conditions in 2022 included:
- Arthritis: 48%
- Hypertension: 59%
- High cholesterol: 48%
- Diagnosed diabetes: 20%
- Any type of cancer: 26%
- Coronary heart disease: 15%.
19. What percentage of older adults rely on prescription medications?
In 2022, 90% of older Americans reported using prescription medications in the past year, with 12% taking medicine for depression and 13% for anxiety or nervousness.
On average, out-of-pocket health care expenditures reached $7,540 per person, a 47% increase from 2012.
20. What role do caregivers play for the older population?
Between 2021 and 2022, 37.1 million family caregivers provided unpaid care to older adults.
Caregivers aged 65 and older were most likely to provide care daily, spending an average of 4.9 hours per caregiving day.
21. How many older adults live in poverty?
In 2022, 10.2% of adults aged 65 and older lived below the poverty level.
The poverty rate for older women (11.2%) was higher than that for men (9%), and older adults living alone experienced the highest poverty rates at 17.7%.
22. How has the diversity of the older population changed?
The racial and ethnic composition of older Americans is shifting.
In 2022, 25% of people aged 65 and older identified as members of racial or ethnic minority groups. By 2040, this percentage is projected to increase to 34%.
23. How many older adults live in nursing homes?
In 2022, 1.3 million older adults lived in nursing homes, with the percentage increasing significantly with age—from 1% for those aged 65-74 to 8% for those aged 85 and older.
24. What are the educational levels among older adults?
By 2022, 89% of older adults had completed high school, a significant increase from just 28% in 1970. Additionally, 33% of adults aged 65 and older held a bachelor’s degree or higher.
25. What are the housing conditions for older adults?
In 2021, 78% of households headed by people aged 75 and older owned their homes, with a median home value of $268,000. However, 45% of these households spent one-third or more of their income on housing.
26. How many older adults received vaccinations in 2022?
In 2022, 71% of adults aged 65 and older reported receiving an influenza vaccination. However, disparities existed among racial and ethnic groups, with vaccination rates highest among non-Hispanic White and Asian older adults.
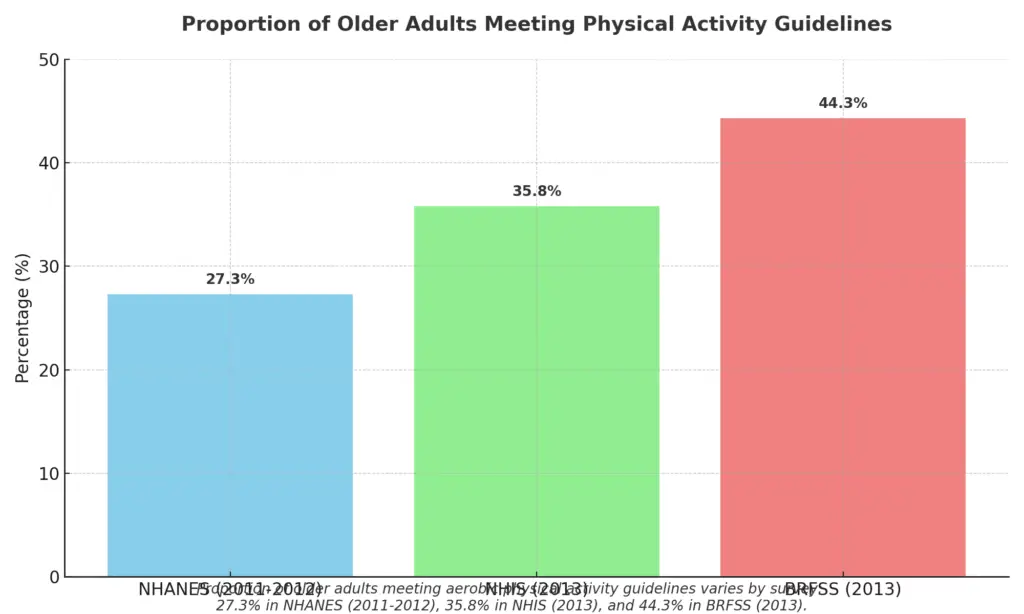
27. How many older adults meet physical activity guidelines?
The proportion of older adults meeting aerobic physical activity guidelines varies by survey:
- 27.3% in NHANES (2011–2012)
- 35.8% in NHIS (2013)
- 44.3% in BRFSS (2013).
28. How does physical activity differ by gender among older adults?
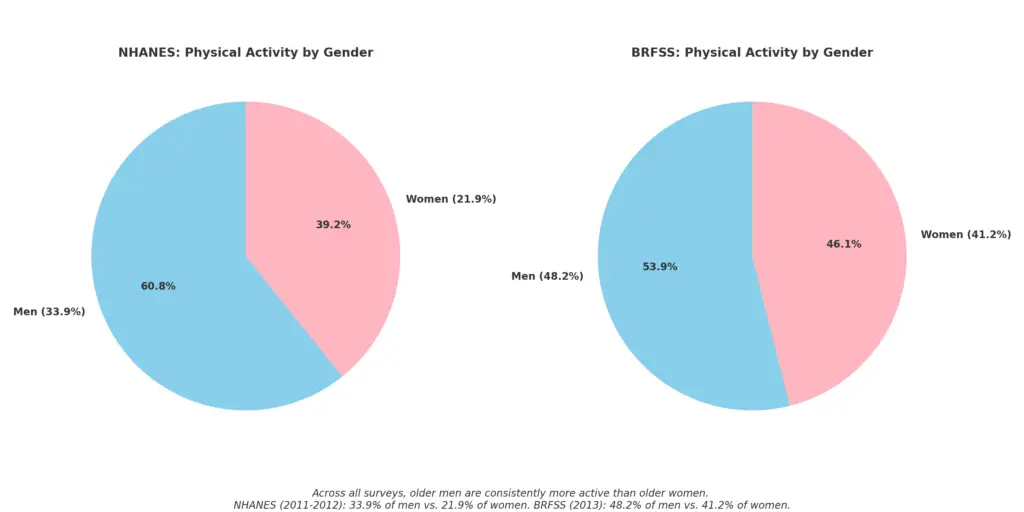
Across all surveys, older men are consistently more active than older women:
- According to the National Health and Nutrition Examination Survey (NHANES), 33.9% of men met guidelines compared to 21.9% of women.
- According to the Behavioral Risk Factor Surveillance System (BRFSS), 48.2% of men met guidelines compared to 41.2% of women.
29. How does age affect adherence to physical activity guidelines?
Adherence to guidelines declines with age:
- According to the National Health Interview Survey (NHIS), 41.7% of adults aged 65–74 met guidelines compared to 18.4% of those 85 and older.
- In BRFSS, adherence was highest among those aged 65–74 (47.8%) and lowest among those 75 and older (39.5%).
30. What is the prevalence of strength training among older adults?
The proportion of older adults meeting strength training guidelines (≥2 times per week):
- 16.7% in NHIS (2013)
- 21.6% in BRFSS (2013)
- Men consistently reported higher levels of strength training than women.
31. What factors influence physical activity in older adults?
Physical activity levels are influenced by:
- Functional limitations: Older adults without limitations are more likely to meet guidelines than those with limitations (e.g., 49.7% vs. 31.8% in BRFSS).
- Race/ethnicity: Non-Hispanic Whites are more likely to meet guidelines than Non-Hispanic Blacks or Hispanics.
32. How has adherence to physical activity guidelines changed over time?
Trends indicate an increase in adherence:
- In NHIS, the proportion meeting guidelines increased from 25.7% in 1998 to 35.2% in 2013.
- The percentage of older adults reporting no leisure-time physical activity decreased from 55.9% in 1998 to 43% in 2013.
Summary
The aging population is reshaping societies globally, with significant implications for today’s older adults in the United States.
These facts about aging populations highlight that the number of Americans in older age groups is steadily increasing. As a result, robust systems are needed to manage chronic diseases and promote healthier lives.
As health statistics reveal, physical activity and preventive care are vital for ensuring healthy aging.
In the coming decades, addressing the needs of aging populations will require innovative approaches to quality health care, long-term care, and policy planning.
Sources
Federal Interagency Forum on Aging Related Statistics
FREE STATISTICS INFOGRAPHIC
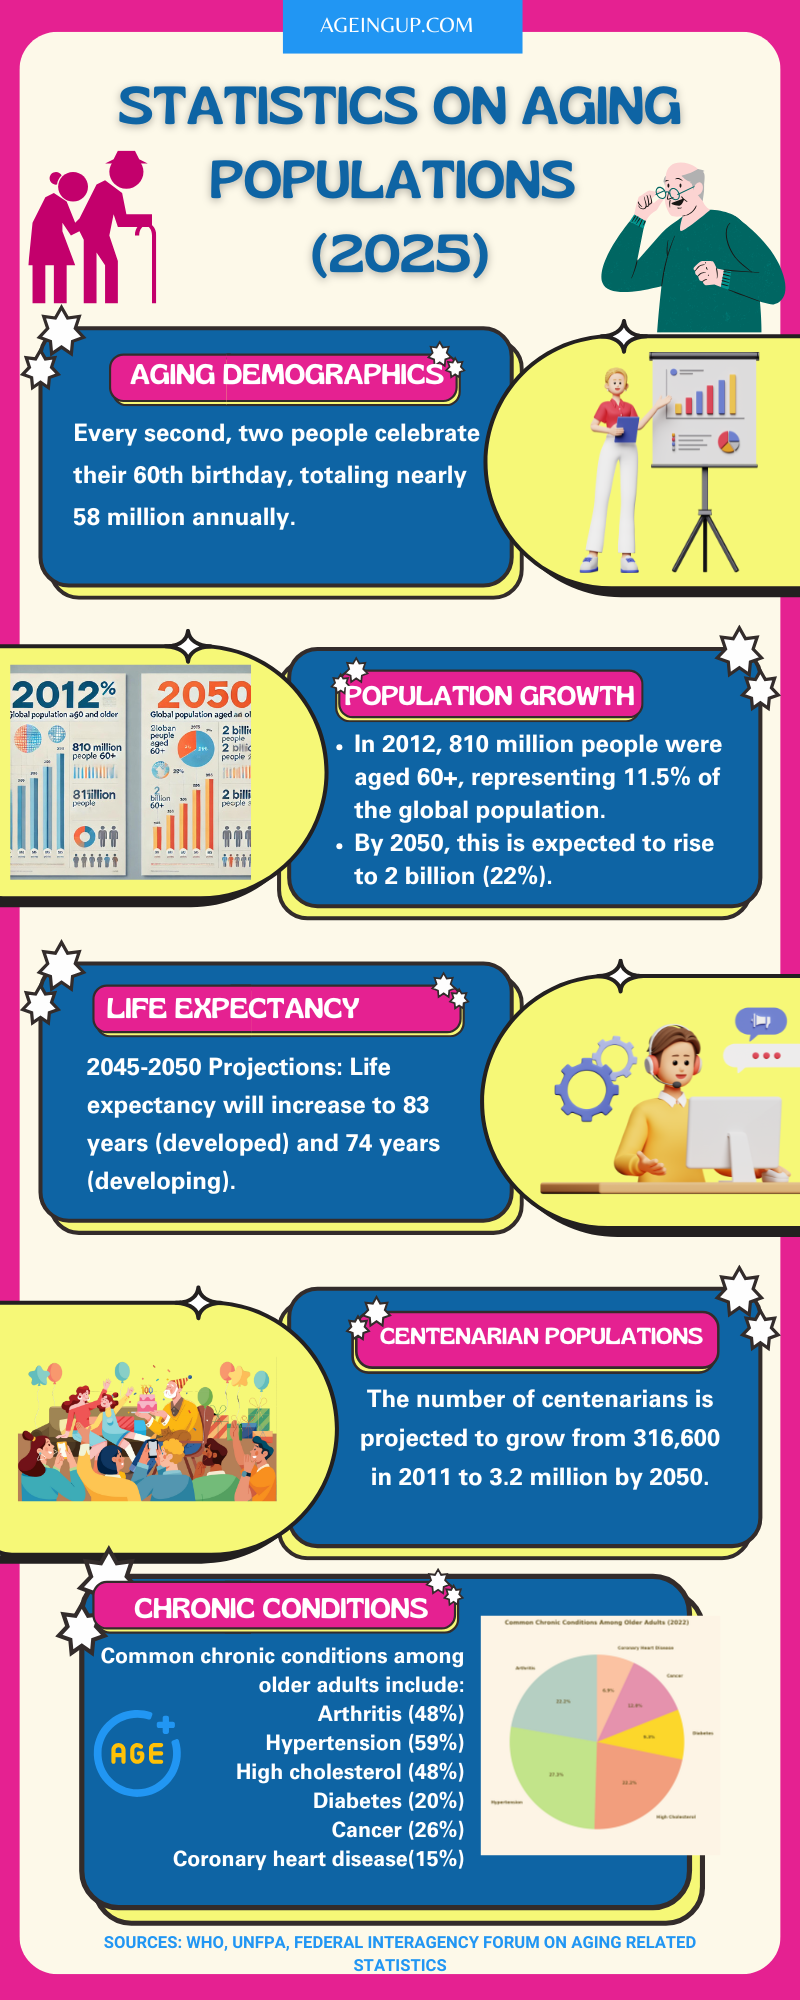
Use This Infographic! Feel free to use this infographic for your website, blog, or educational materials. Just make sure to include a link back to our full post: Facts About Aging Populations.

